Introduction
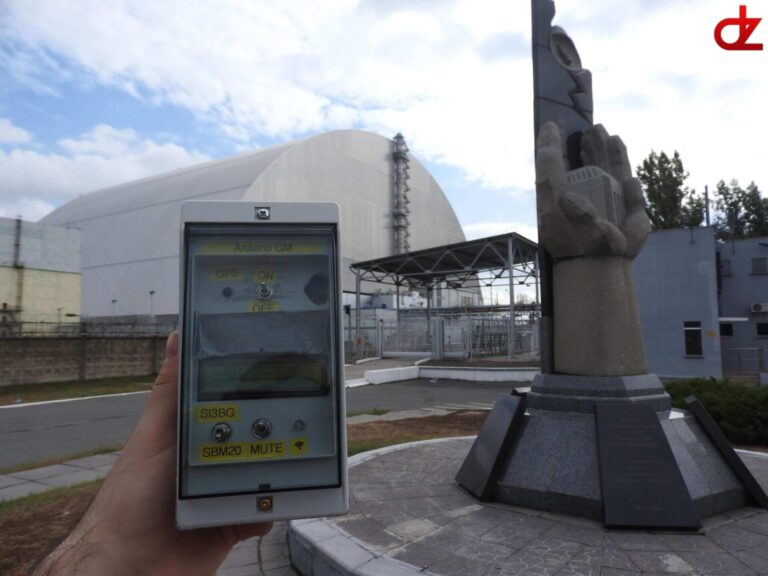
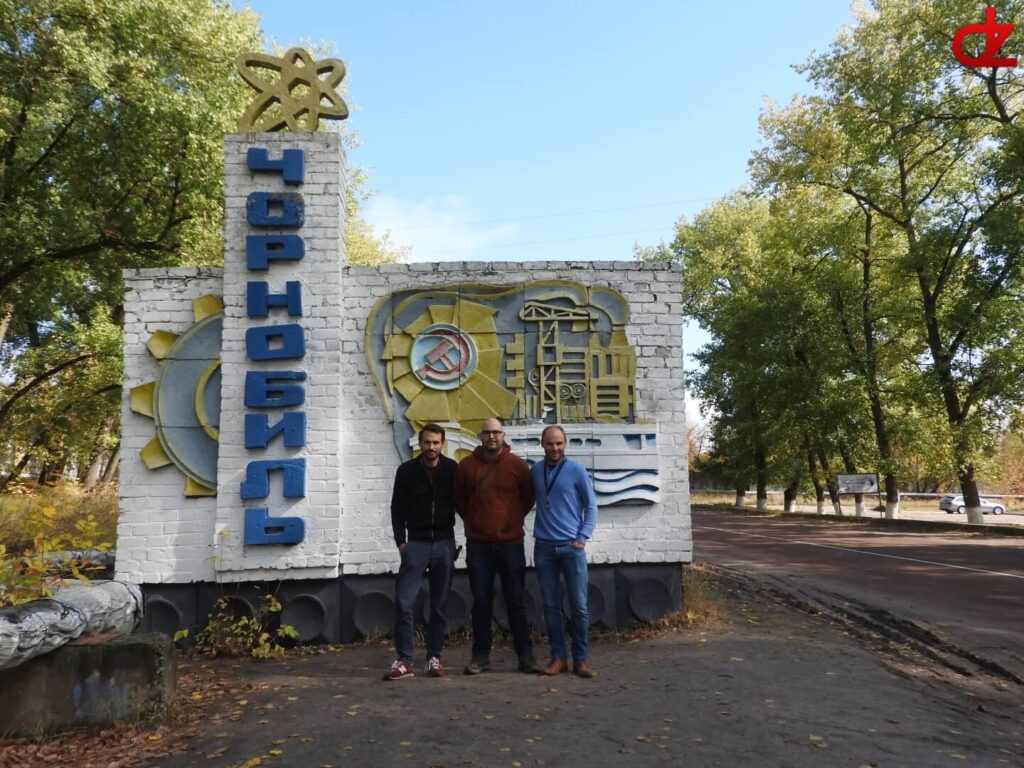
Perhaps an odd project for my site but with some friends we visited the Chernobyl exclusion zone, small town of Zalyssa, city of Pripyat (Get out of here Stalker), Chernobyl (Vladimir Ilyich Lenin) nuclear power plant and Duga 3 Over The Horizon (OTH) Radar installation receiver on the 29th of September 2019 with a self made dosismeter.
Alongside a certified dosimeter-radiometer (Terra-P Ecotest) and my own custom build Arduino Geiger Counter kit with GPS location and date-time logging we explored the zone.
Like for many people Chernobyl has certain lure to it and it’s surrounding, that is a must see location on how technology can turn out horrible and destroy a vast area.Luckily thanks to the sacrifice of many people from different parts of the world the zone is very slowly recovering, though this will take ages.
The zone has an eerie beauty to it, nature is reclaiming the zone ever so gradually, wildlife and dogs are flourishing.
There is even a good cause active for the “Dogs of Chernobyl” for those who are interested.Though I believe there is a local Ukrainian cause as well, unfortunately I haven’t found it.
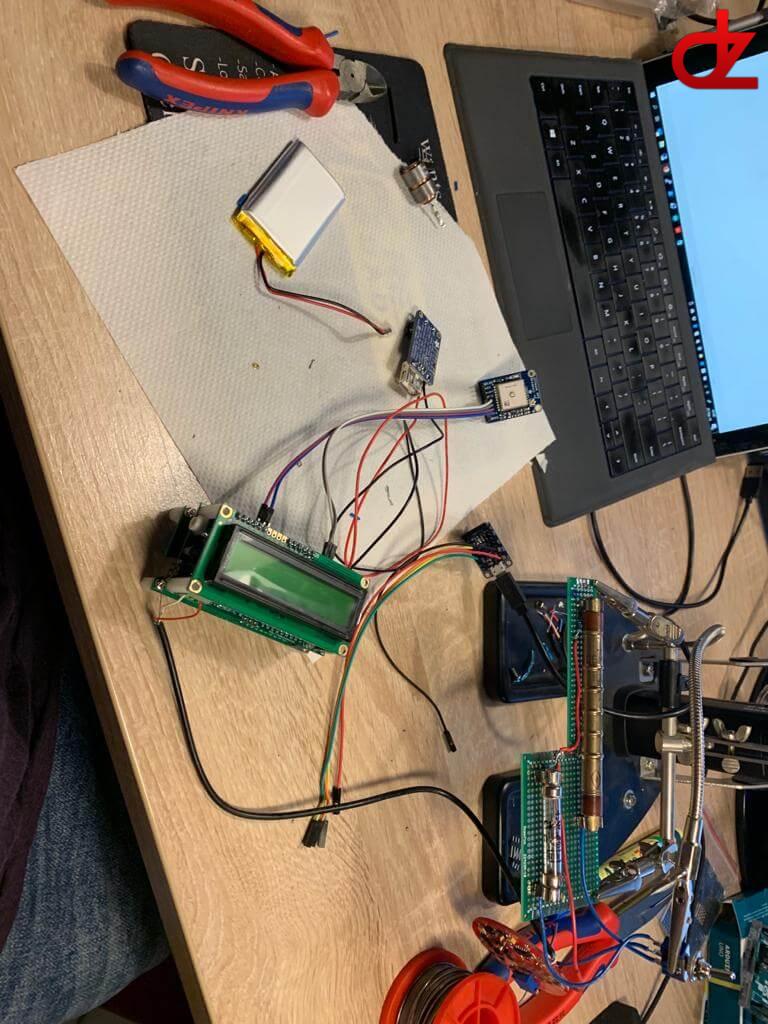
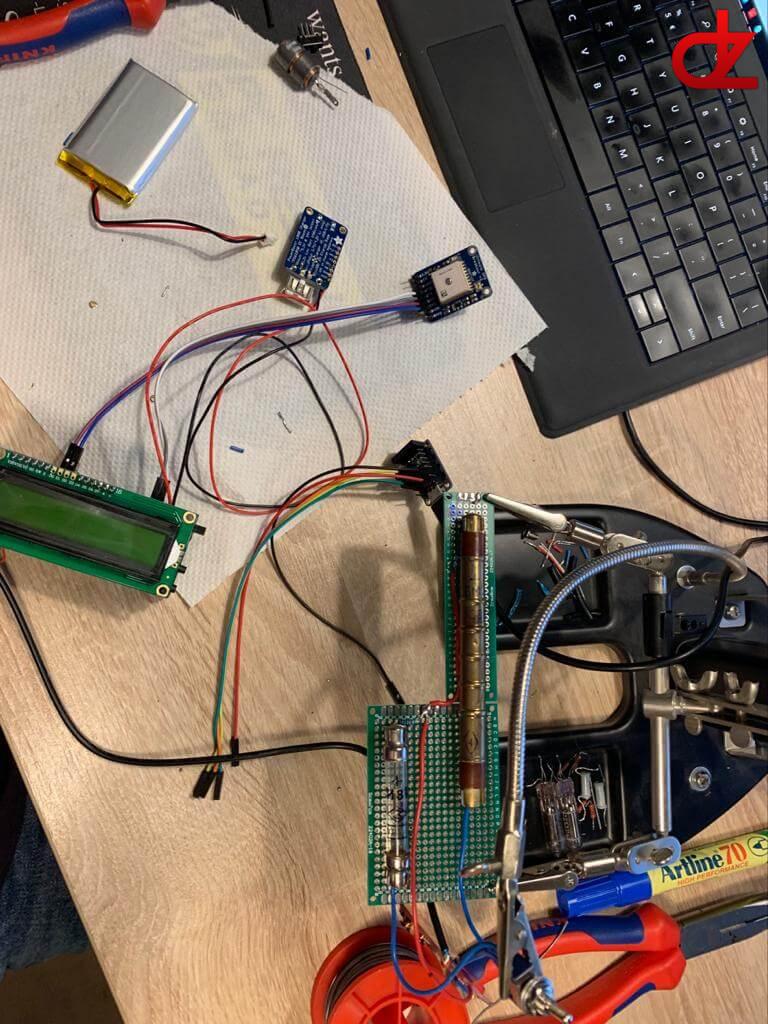
The Geiger counter consists of
- RH Electronics High Voltage Geiger Probe Driver Power Supply Module 380V-550V with TTL Digitized Pulse Output
- RH Electronics Arduino IDE Geiger Counter DIY Kit Radiation Logger with LCD and Free Monitoring Software with SD Shield w/o GM Tube
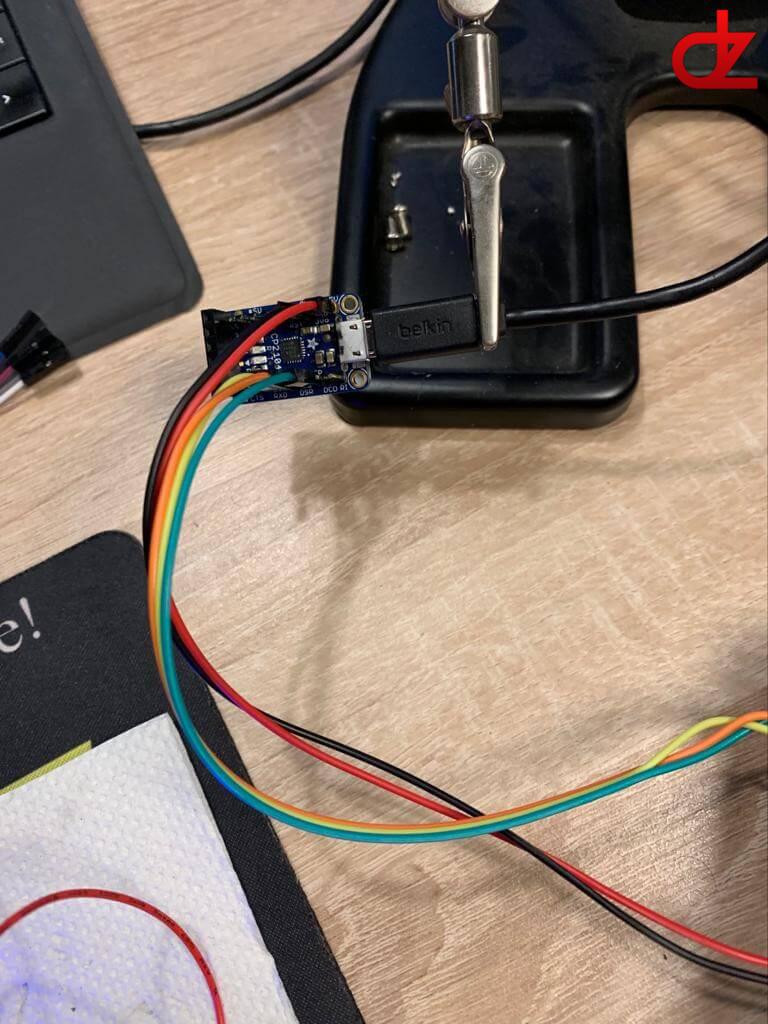
- Adafruit Ultimate GPS Breakout – 66 channel w/10 Hz updates
- Adafruit PowerBoost 1000 Charger – Rechargeable 5V Lipo USB Boost @ 1000mA+
- Adafruit Lithium Ion Polymer Battery – 3.7v 2500mAh
- A fusebox for the cover housing (really)
- An SI-3BG tube for high radiation measuring
- An SBM-20 tube for low radiation measuring
- Some switches, cables, …
Both the SI-3BG and SBM-20 were scavenged from a defunct DP-5V probe.
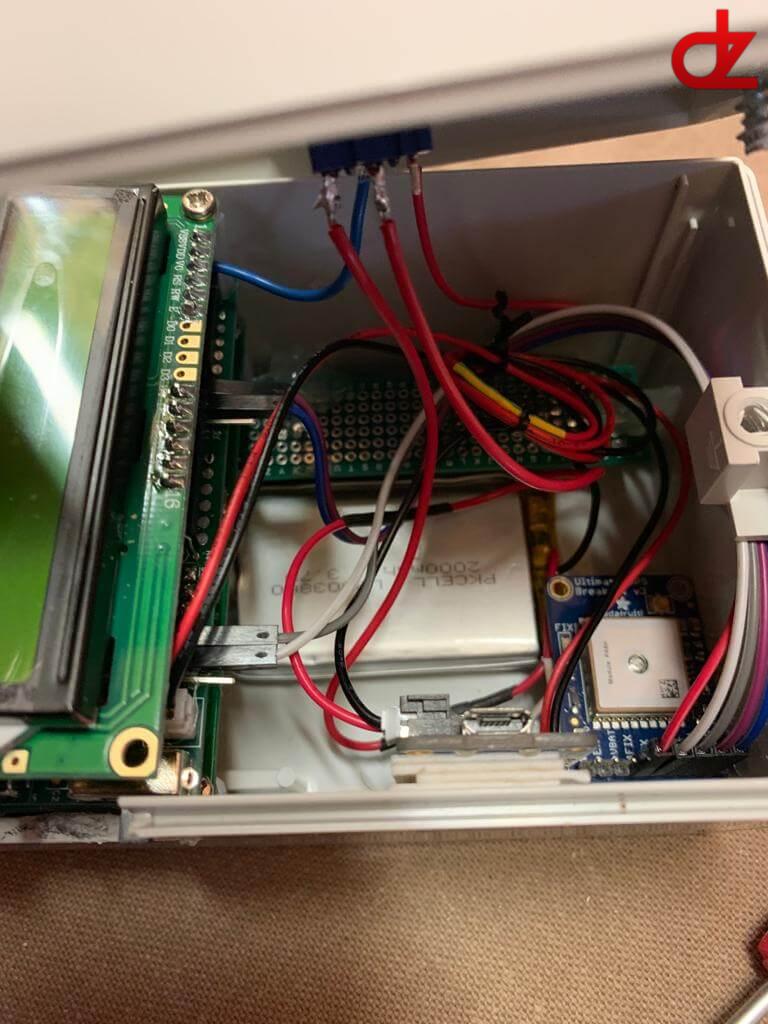
The insides
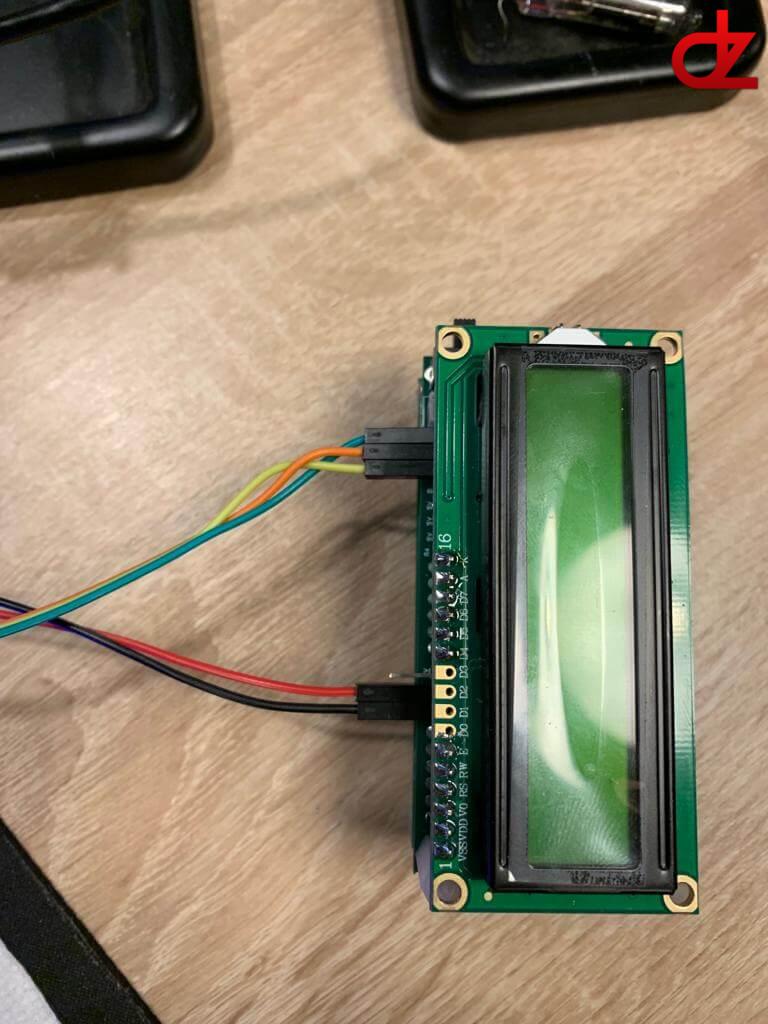
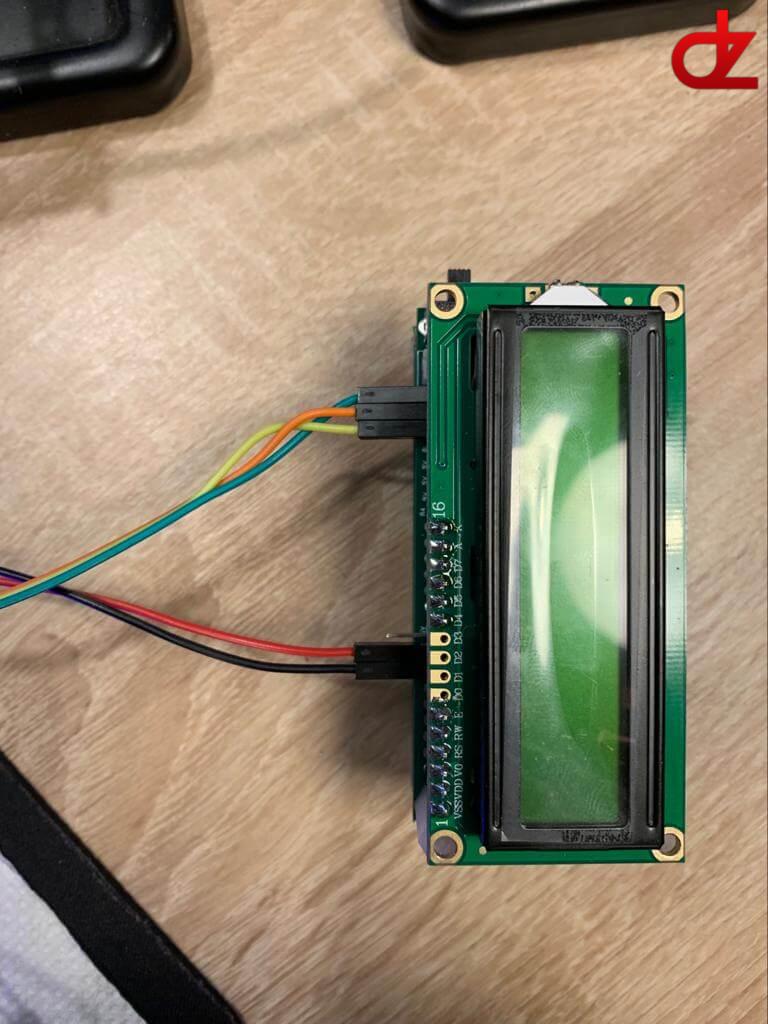
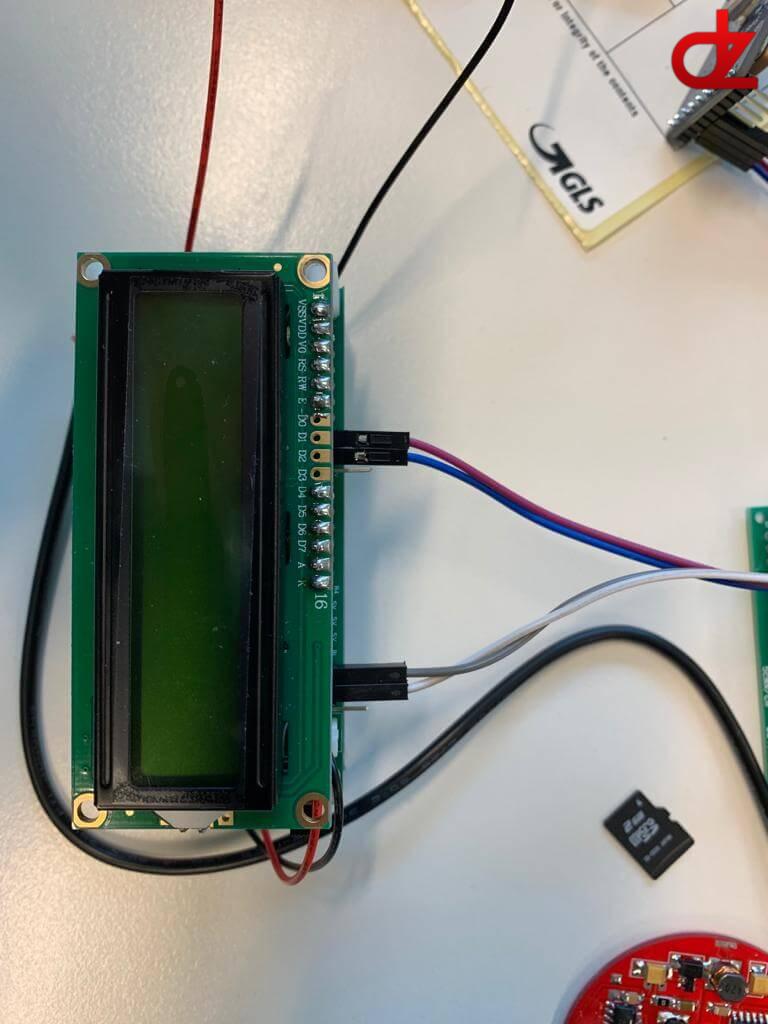
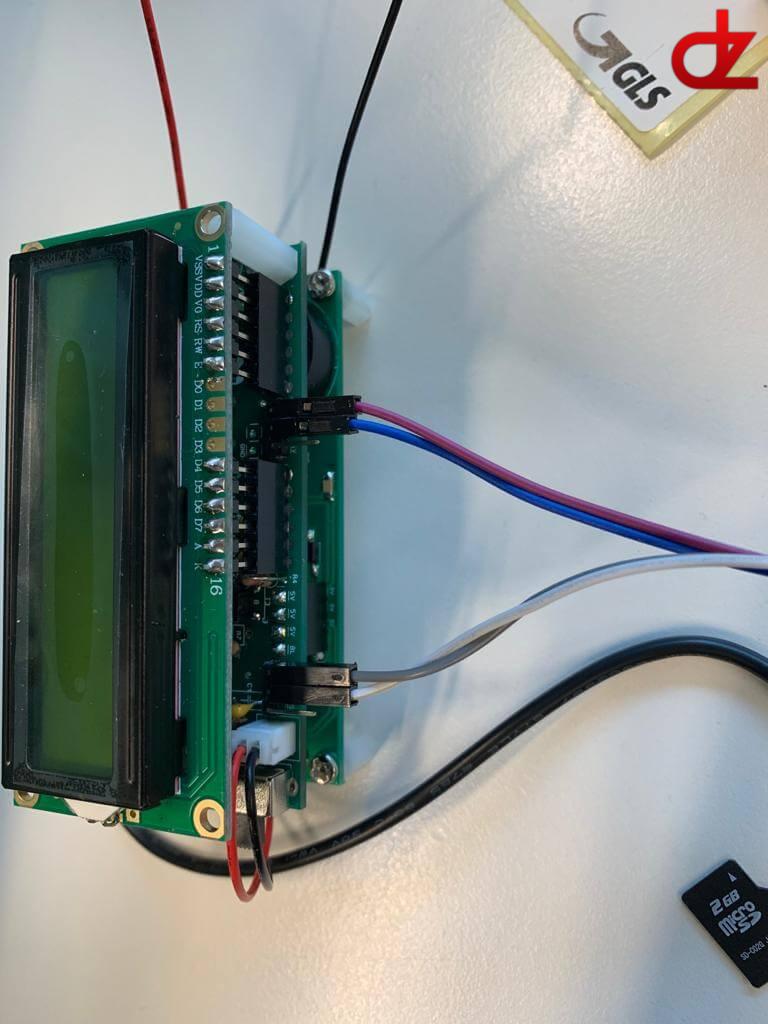
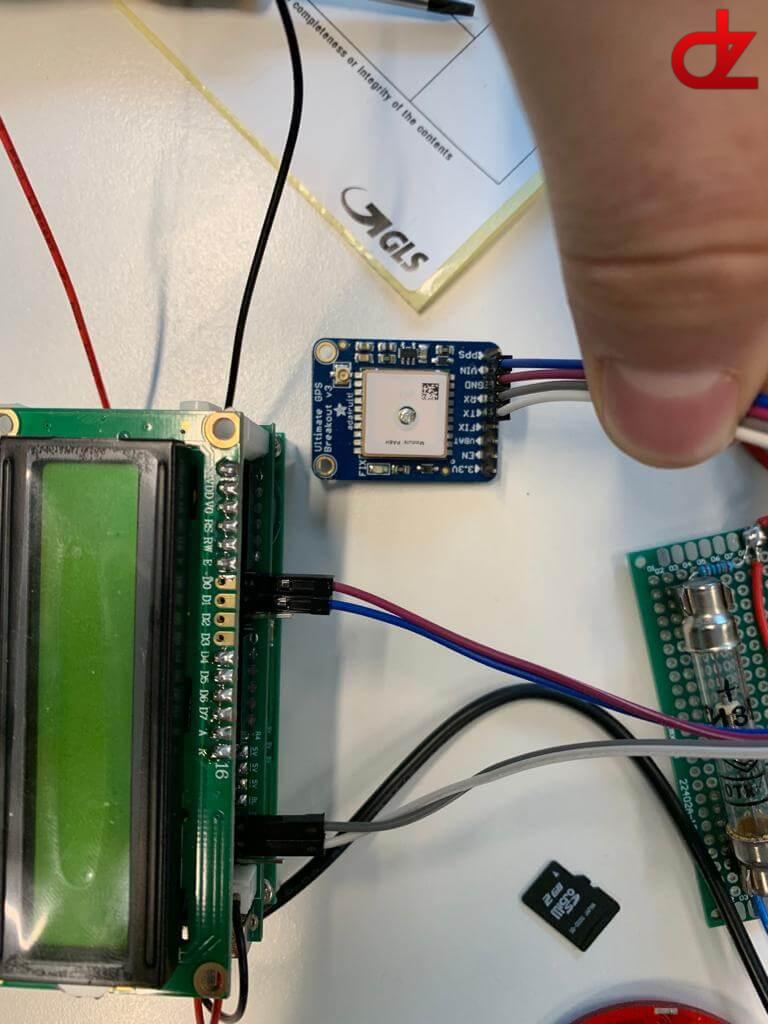
How it works?
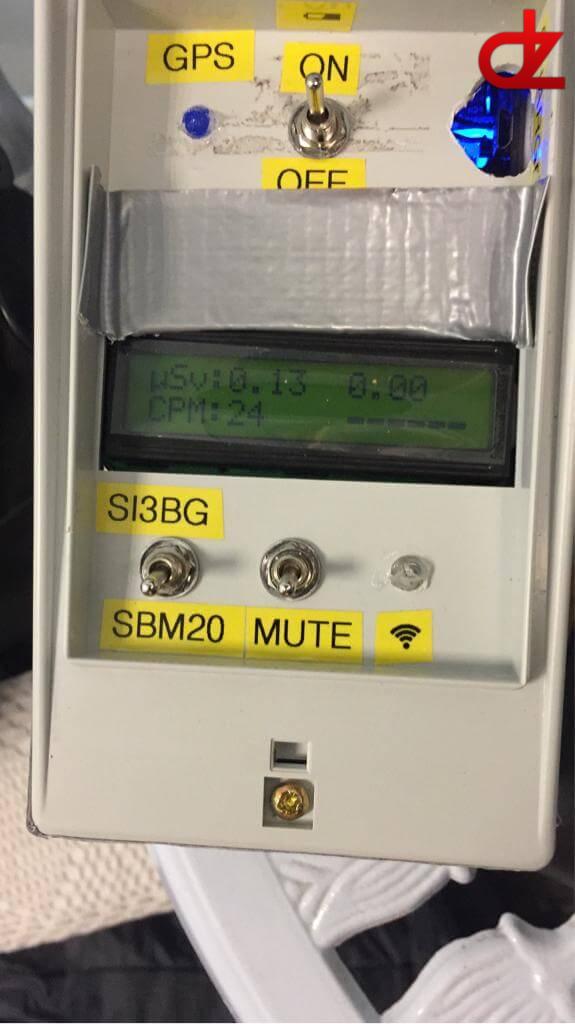
Behind the LCD screen rests the onboard Arduino with controls and logging capability. Instead of using the build in power supply the SBM-20 and SI-3BG tubes a powered by the High voltage driver to supply a more steady TTL signal and very stable power supply, which feeds back into the controller.
To do so the creator of the board helped me with bypassing the needed components to directly feed it into an 2N3904 transistor which connects to INT0 of the Arduino.
Each count logs the GPS location (NMEA format), date, CPM (or uSV/HR) and total absorbed amount (in uSV) to the SD card.
The end result is this neat box which fitted in my camera bag perfectly and worked like a charm, measurement against the Terra-P Ecotest dosimeter our control unit was a bit different. The counting was a bit slower, though the results were very similar!
Only a few minor differences in the readouts which were negligible.
Future projects are a 3D printed case and a roof or wall mounted GM utilizing an SI-22G that logs radiation for my region for the whole year.
Close up
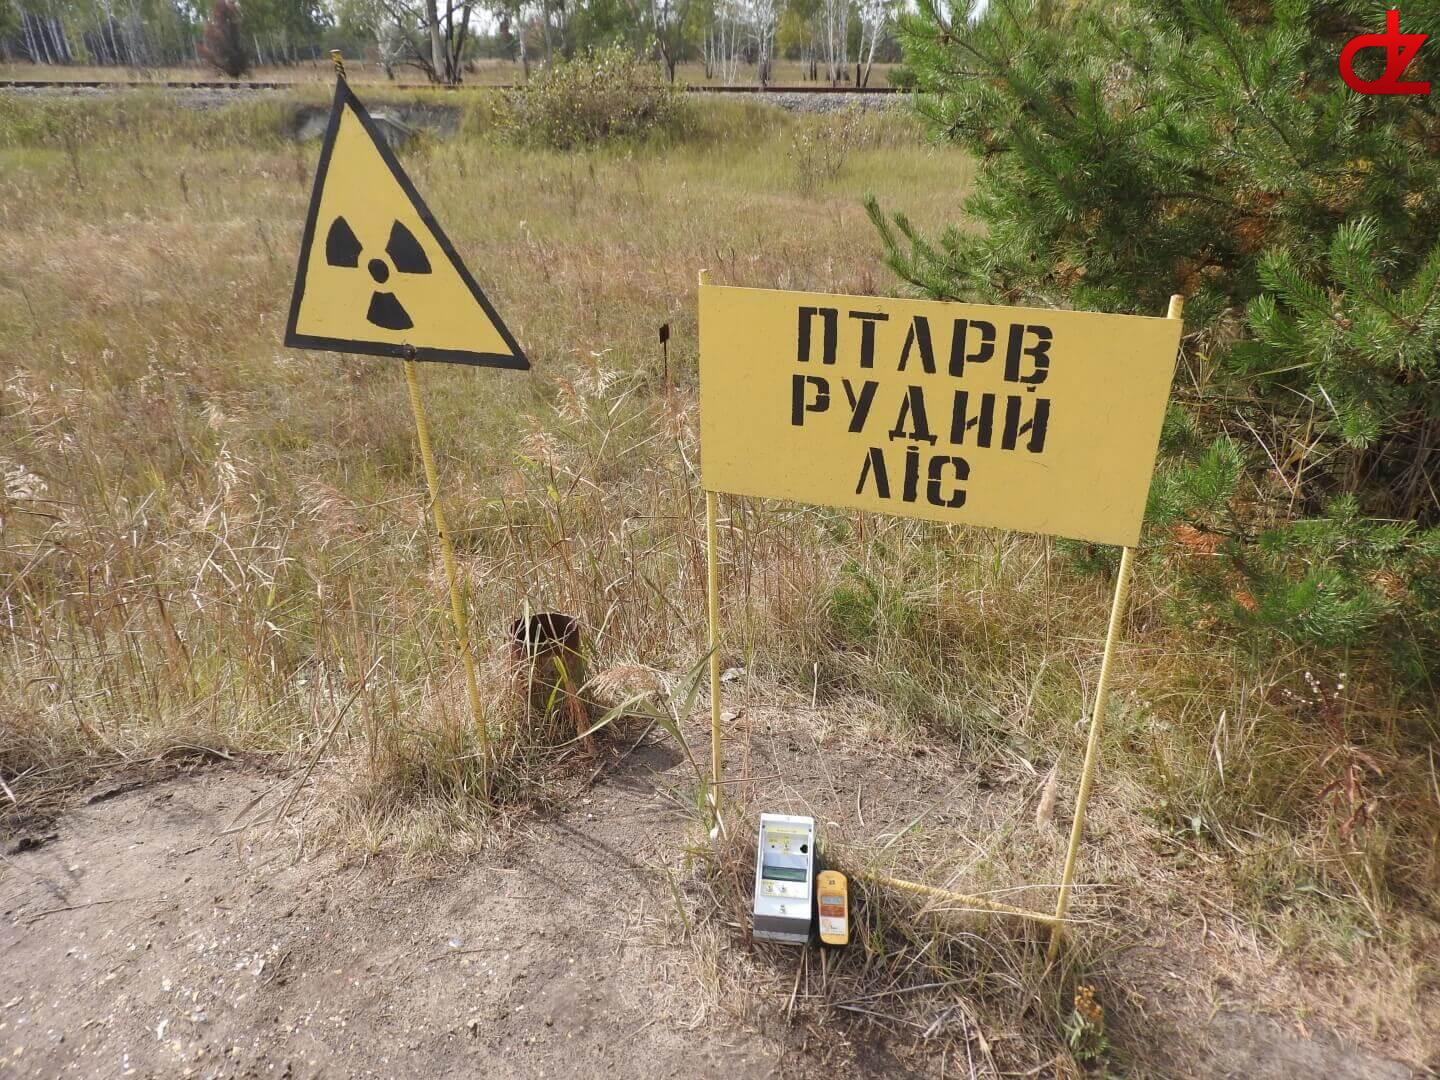
- One of the many warning signs alongthe edge Red Forest with in the background the railroad leading to the Yanov train station. Featuring both dosimeters.
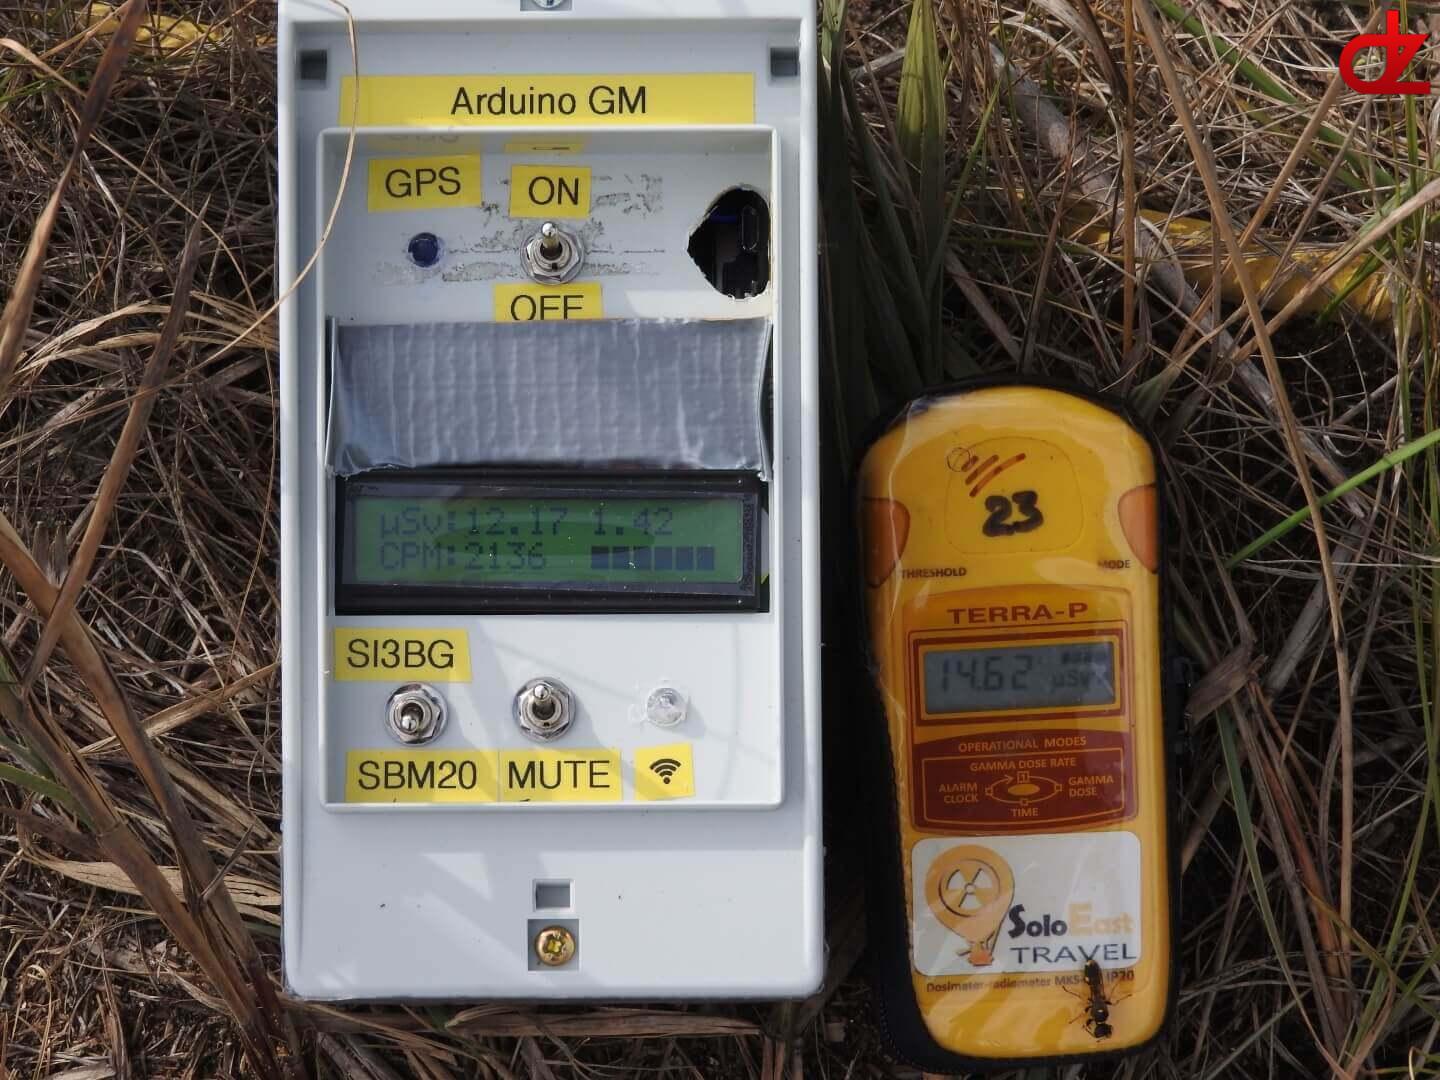
- Secondly a close up of both dosimeters (left my custom build Geiger Counter and on the right the Terra-P from Ecotest).
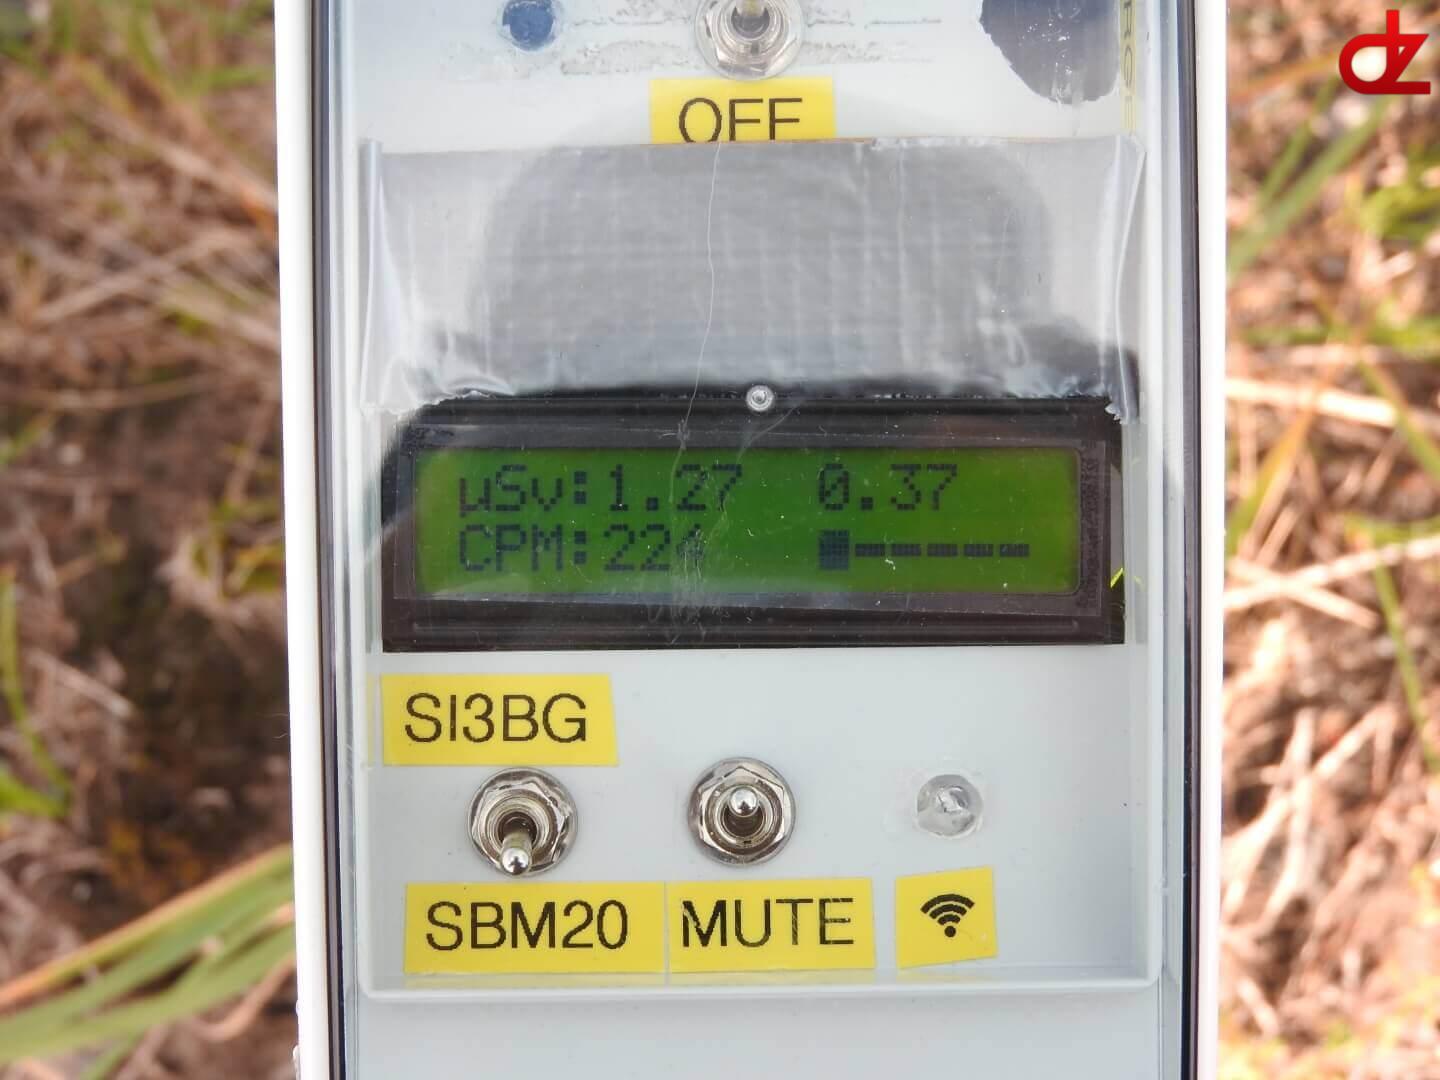
- Lastly a close up of my Geiger counter with a CPM of 224 and both increasing fast.
CPM to uSV (Top 20)
For the SBM-20 I’ve used 0,0057 as the conversion factor.
The SI-3BG conversion factor is 0,631578.
The median was 41,5 CPMs or 0,23655 uSV/HR for most areas.
Highest counts occurred around the plant (336 CPM or 1,9152 uSV/HR) and the beginning of the Red Forest area (2227 CPM or 12,6939 uSV/HR).
Our total dose we had during our visit was 3,35 uSV (or 0,0003590697 Roentgens).
Which is below a dental X-Ray (5 uSV).
| # | CPM | uSV/HR |
| 1 | 306 | 1,7442 |
| 2 | 315 | 1,7955 |
| 3 | 322 | 1,8354 |
| 4 | 323 | 1,8411 |
| 5 | 330 | 1,881 |
| 6 | 333 | 1,8981 |
| 7 | 336 | 1,9152 |
| 8 | 344 | 1,9608 |
| 9 | 354 | 2,0178 |
| 10 | 370 | 2,109 |
| 11 | 373 | 2,1261 |
| 12 | 405 | 2,3085 |
| 13 | 435 | 2,4795 |
| 14 | 437 | 2,4909 |
| 15 | 597 | 3,4029 |
| 16 | 779 | 4,4403 |
| 17 | 966 | 5,5062 |
| 18 | 2040 | 11,628 |
| 19 | 2119 | 12,0783 |
| 20 | 227 | 12,6939 |
While we walked around the zone, the first thing you notice is the silence, we didn’t hear many birds, the day when we visited it also rained a bit in the morning which gave the tour an even more eerie feeling. Though wildlife is returning to the zone, the saddest part was to see litter in the zone from other visitors…
More information can be obtained from the downloadable logs below.
Interactive map with radiation in CPM and GPS route
Below you can find an interactive map that display each logging point with the CPM listed. On it you will see the route we took and which was the highest. The red forest had the highest counts as this area had the biggest hit of fallout during the incident.